Yes. Compass is included with Analyst, Pro and Enterprise plans. It isn’t available on Starter or Free plans.

Compass by KNO
See how your post-purchase data compares to similar brands
Compass benchmarks your post-purchase data against similar brands in your industry, so you know which numbers are actually worth reacting to. Available on Analyst+ plans.
Same number. Different decision.
Every number below is one you already have. The right column adds the one thing your report has never shown you.

Without Compass
- Podcast: 6% of discovery
- Social ads: 34%
- First-time buyers: 60%
- Revenue given as discounts: 18%

With Compass
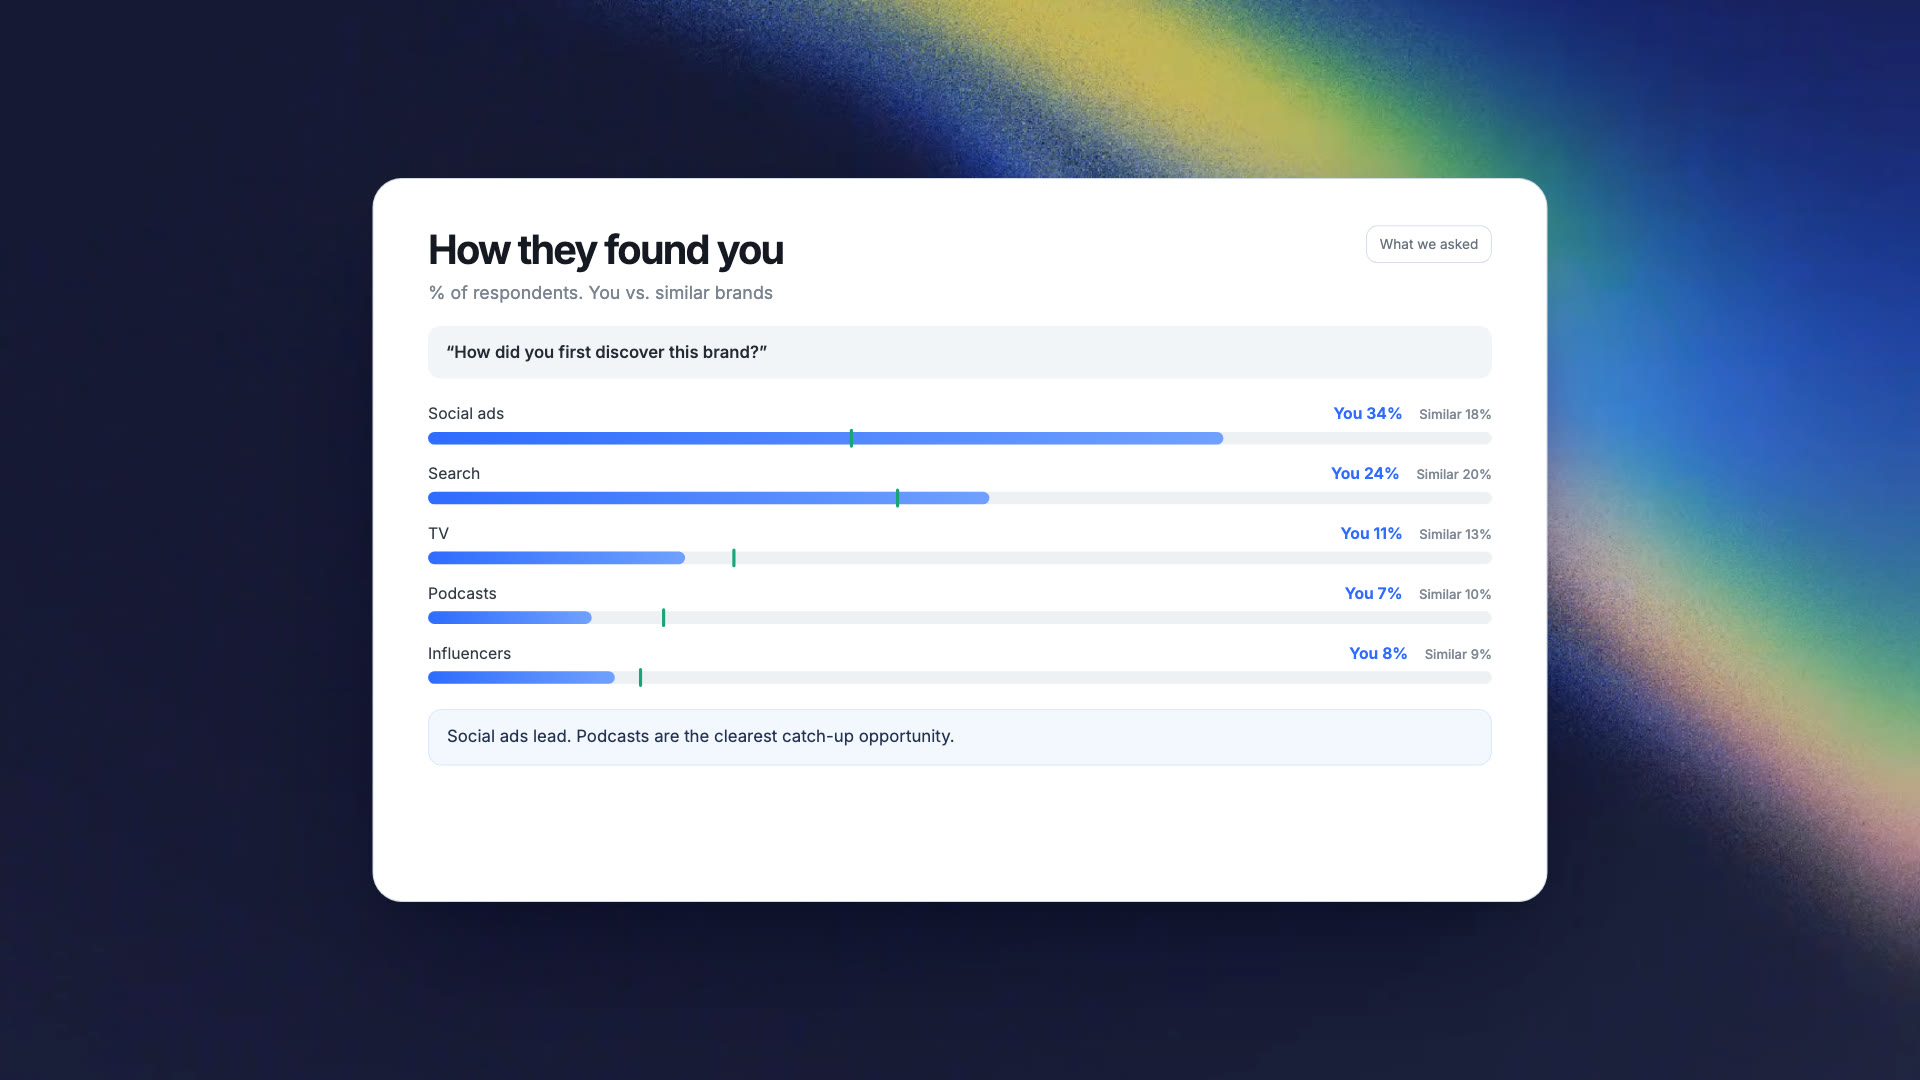
- Podcast: 6% · similar brands: 9%
- Social ads: 34% · 2x similar brands
- First-time buyers: 60% · similar brands: 48%
- Revenue given as discounts: 18% · rated Fair
*Sample data shown.
See Compass in action
*Sample data shown.
Why guess when you can compare?
Your numbers only mean something next to someone else's.
Know what good looks like.
Every metric shows up with the context it's been missing.
Tell a fire drill from a seasonal dip.
When performance moves, see whether similar brands moved with you. One of those is worth a meeting. The other isn't.
Find the gap worth closing.
Podcast at 6% when similar brands sit at 9% is a testable opportunity, not a hunch.
Defend the spend you're already making.
Social ads running at 2x the category is a budget argument anyone can follow.
Benchmarks nobody else has.
Attribution and sentiment here come from what your customers say, not what a tool infers. No other dataset compares that across brands.
See the market, not the names.
You never see another brand's name, and they never see yours. Results are pooled, and small groups stay hidden.
What's in the report?
What's in your report
Your customers' answers and your order data, read side by side against similar brands.
Built from real Shopify brands, not a research panel
Every brand that turns it on makes the benchmark sharper for everyone in the set.


How Compass works
Turn it on once. The report keeps building.
-

1. Turn on Compass
One click, on Analyst, Pro and Enterprise plans. -

2. We run one standardized survey
A short post-purchase survey runs on your store. Same questions for every brand, which is what makes the comparison possible. -

3. Your report builds
It takes a little time to collect your data, but don't worry, we'll email you as soon as your report is ready. Most brands see it within 15 to 30 days, depending on order volume. -

4. Compare and act
Catch up where you're behind, spend more where you're ahead. Change the time window to see how you and similar brands moved between periods. -

5. Pause anytime
Pause Compass anytime in Settings. While it's paused, the survey stops showing and your report is hidden.
Compared to the typical brand, not the average
One outlier can't move your benchmark.
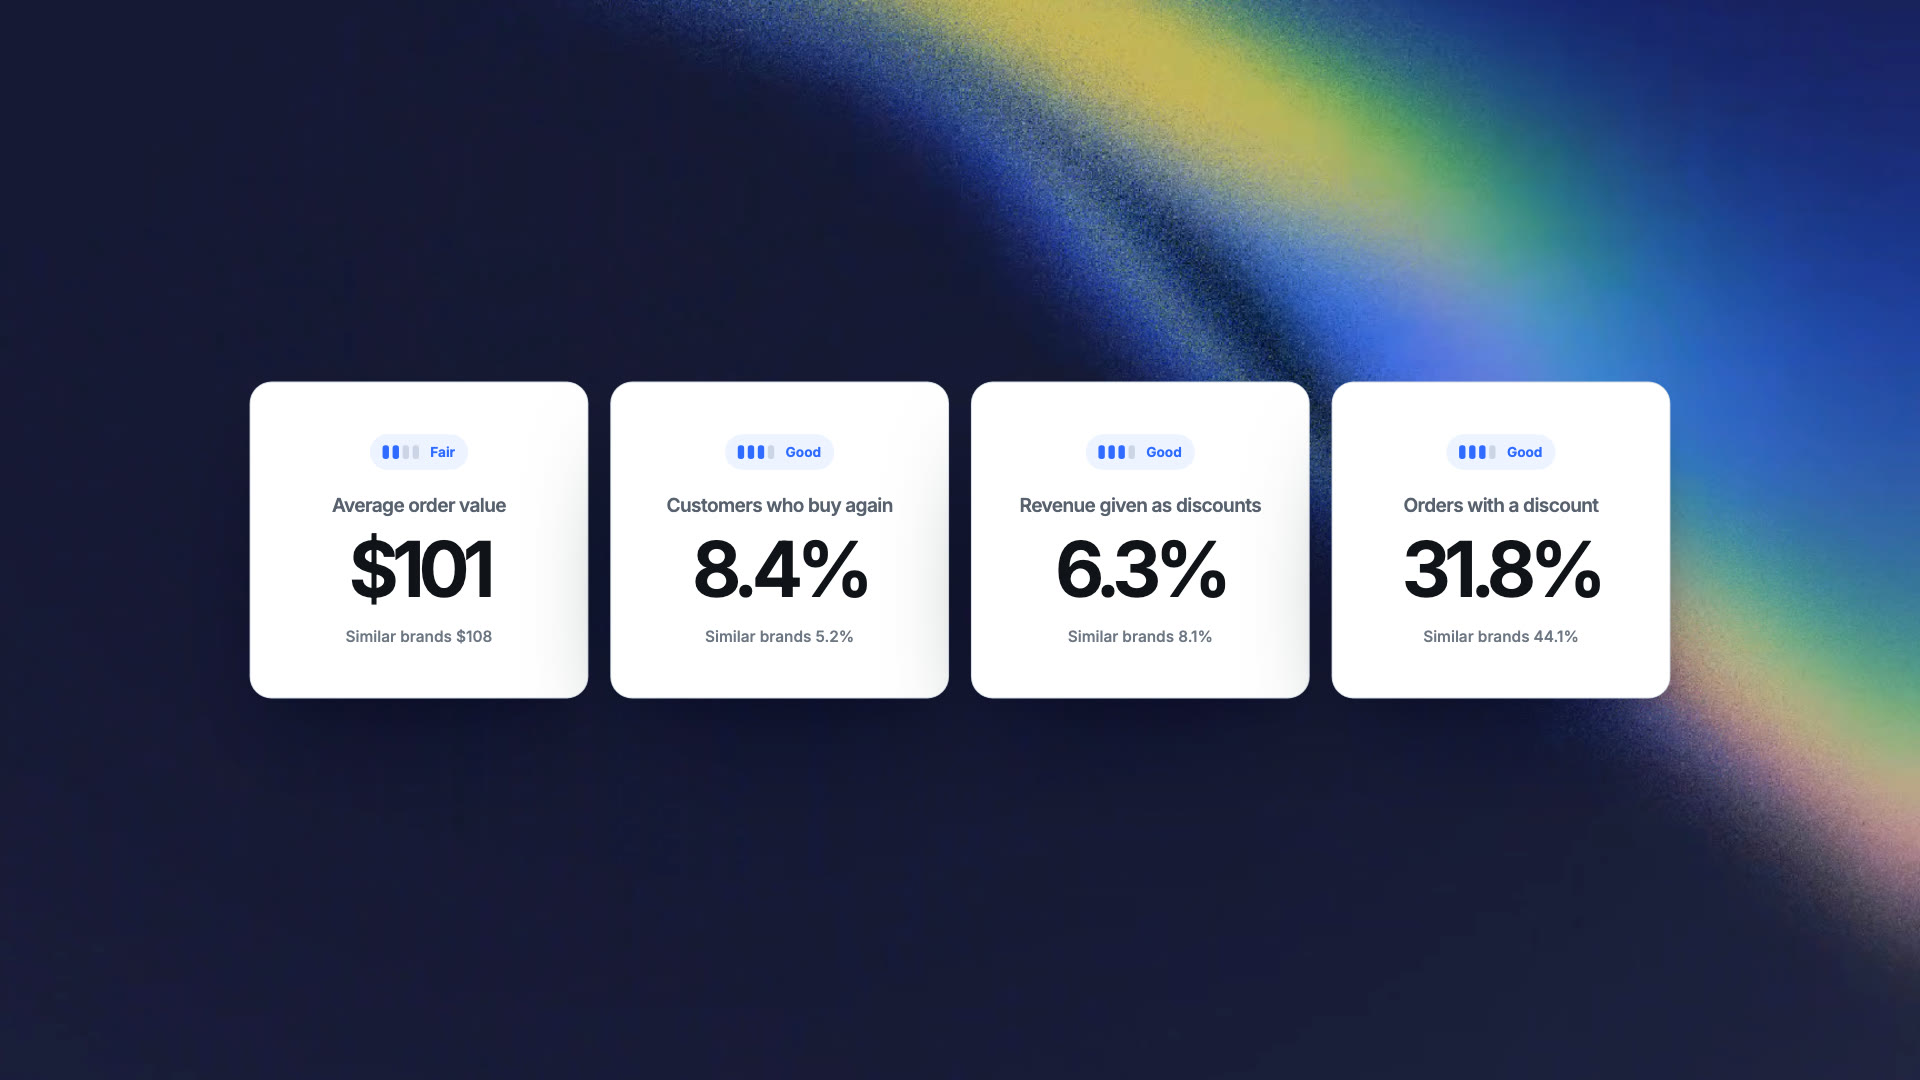
Order value, repeat rate and discounting are graded Fair, Good or Excellent against the typical brand in your industry. Your customers' answers are never graded, because a different audience isn't a worse one. Where you differ most, we show you.
*Sample data shown.
You never see another brand's name, and they never see yours
Everything is anonymized.

Want more than Compass?
Compass is included with Analyst plans and above, along with your own surveys, audiences and integrations. New to KNO? Get 50% off your first 3 months through the end of 2026.
New KNO plans only. Offer ends 31 December 2026.
Questions about Compass
No. You never see another brand’s name, and they never see yours. Results are pooled across many brands, and groups too small to report on stay hidden.
A short survey built by KNO that shows on your Thank You page, your Order Status page, or the equivalent page on non-Shopify platforms. It asks customers how they found you, who they shop for, what they look for, and how their spending is trending. Those answers power your report alongside your order data. (See question: “What if I already run post-purchase surveys”)
Your surveys keep running as they are. Compass runs as your Fallback Survey, so it only shows to customers who no longer qualify for any of your other live surveys. It only shows to customers who don’t qualify for your other surveys. Those keep running as they are. If you already have a Fallback Survey, you’ll be asked to confirm before it’s replaced.
Other KNO brands in your industry. If your industry doesn’t have enough brands on KNO yet for a fair comparison, you’re compared against all KNO brands. Either way, you’re measured against the typical (median) brand, so one big brand can’t skew the results.
If you’re moving over from Automated Insights, your report is ready as soon as you switch. For new brands, most see their first report in 15 to 30 days, depending on monthly orders. We’ll email you when it’s ready.
Yes. You can pause Compass anytime in Settings. While it’s paused, the survey stops showing and your report is hidden. Turn it back on whenever you like.