
Most CSAT dashboards report a number. Few of them report whether that number means anything.
A 4.6 average sounds great until you realize half the respondents picked the middle option to escape the survey, the scale was labeled inconsistently across questions, and the prompt asked about “your overall experience” without telling anyone which part of the experience was being rated. The score is real. The signal behind it is not.
Rating scales look like the easy part of survey design. They are not. The format you choose, the labels you attach, and the moment you ask all shape the score you ultimately report to leadership. Get the scale wrong, and you measure the survey, not the customer.
Here is how rating scales actually work, what a good CSAT score looks like in the wild, and how to design questions your team can act on.
Understanding CSAT (Customer Satisfaction Score)
CSAT measures how satisfied a customer is with a specific interaction, product, or experience. The survey question is usually some version of “How satisfied were you with [thing]?” and the answer comes back on a rating scale.
The math is simple. Take the percentage of customers who answered positively (typically the top two response options on the scale) and divide by total responses. A 4 or 5 on a 1 to 5 scale counts as satisfied. Everyone else gets filtered out of the numerator.
That simplicity is the whole point. CSAT is meant to be a fast read on a specific moment in the customer experience, not a comprehensive view of brand health. It tells you whether the product, the unboxing, the support ticket, or the return process worked. It does not tell you whether the customer will stay loyal, recommend you, or buy again. Those signals live in NPS, post-purchase surveys, and behavioral data.
CSAT works best when it is tied to a specific event. After delivery. After a support resolution. After first product use. The closer the question sits to the moment, the more honest the response.
Importance of rating scales in measuring CSAT
A rating scale question is the structure customers use to translate a feeling into a data point. Three stars or four. A 7 or an 8. “Satisfied” or “Very satisfied.” Without that structure, satisfaction is just a feeling. With it, you have quantitative data you can segment, compare, and trend over time.
The scale is also where most CSAT programs quietly fall apart. Two common failure modes:
- The scale is too vague. A customer who picks “neutral” could mean anything from “the product was fine” to “I had a problem but I do not want to leave a bad review.” You cannot route either response correctly because you cannot tell them apart.
- The scale is inconsistent. One question uses 1 to 5, the next uses 1 to 10, the third uses worded labels with no numbers. Customers slow down to figure out what the new scale means. Response rates drop. The data you do collect cannot be compared across questions.
Good rating scales reduce friction and produce data you can actually segment. They are short, consistent, clearly labeled, and matched to the question being asked. That is the bar.
Rating scale types
There is no single correct scale. There are scales that fit specific question types better than others. A few formats cover most of what an ecommerce brand will ever need.
1 to 5 Rating Scale
The 1 to 5 scale is the workhorse of CSAT. Five options give customers enough range to express a real opinion without forcing them to weigh the difference between a 6 and a 7. Completion rates are high because the choice is fast.
Use it when you want a quick read on satisfaction with a specific event. A few examples:
- How satisfied were you with your delivery experience?
- How would you rate the quality of this product?
- How easy was it to find what you were looking for?
This is a classic 5-point scale. Label the endpoints clearly. “1 = Very dissatisfied” and “5 = Very satisfied” leaves no room for interpretation. Avoid leaving the middle option unlabeled if you can help it. A labeled middle (“Neutral” or “Neither satisfied nor dissatisfied”) gives customers permission to sit on the fence honestly instead of picking 3 by default.
Rating Scale 1 to 10
The 1 to 10 scale gives you more granularity, which matters when you need to segment respondents into meaningful groups. The Net Promoter Score (NPS) is the most common example. Promoters are 9 or 10, passives are 7 or 8, detractors are 0 to 6. The scale exists because those cutoffs carry real weight.
Use 1 to 10 when you need to identify and route different response groups, not just calculate an average. CSAT itself usually does not need this much range. A 5-point scale is faster to answer and produces cleaner data for the question CSAT actually asks.
Other Types of Rating Scales Worth Knowing
Beyond the two workhorses, there are a handful of other types of rating scales that show up in CSAT and market research. Most fit specific use cases rather than serving as a default:
- Likert scale. A symmetric agreement scale, usually 5 or 7 points, running from strongly disagree to strongly agree. Useful when you want to test how strongly a customer agrees with a specific statement rather than rate a generic experience.
- Semantic differential scale. A bipolar scale anchored by two opposing adjectives (cheap to premium, slow to fast). Useful for brand perception studies.
- Numeric rating scale. A simple integer scale where customers pick a number. The 1 to 5 and 1 to 10 formats above are both numeric.
- Graphic rating scale. A visual continuum customers mark along, often used in performance reviews. Less common in ecommerce CSAT.
- Slider scale. A continuous slider customers drag to a position. Works well in mobile contexts but produces messier data than a discrete scale.
- Frequency scale. Used to measure how often something happens (Never, Rarely, Sometimes, Often, Always). Useful for usage and behavioral questions.
Most of these sit on the ordinal scale (ranked categories, no equal spacing) rather than a true interval scale (where the distance between points is meaningful). That distinction matters when you start calculating averages. A 4 is not literally twice as satisfied as a 2 on most rating scales, even if your dashboard treats it that way.
When to Use Various Rating Scales
A few rules of thumb for picking the right one:
- 3-point scales (Good / Neutral / Bad) work for high-frequency, low-stakes closed-ended questions like “Was this article helpful?” Anything more granular is overkill.
- 5-point scales are the default for CSAT. Use them unless you have a specific reason not to.
- 7-point scales are common in academic research but rarely add value in ecommerce. Customers process them as 5-point scales anyway.
- 10-point scales belong with NPS and questions where you need to identify outliers or segment groups by score.
- Emoji or smiley face scales can work in mobile-first contexts but are harder to benchmark against industry data. Use them on thank-you pages or in-app prompts where speed matters more than precision.
The principle: match the scale to the decision you plan to make with the data. If you are not going to route promoters and detractors differently, you do not need 10 points.
Survey scale examples for CSAT
The best rating scale questions feel obvious to answer. Customers should not have to re-read them. A few formats that do the work.
Good to Bad Scale
A simple bipolar scale works for almost any satisfaction question. Anchor the endpoints, label the middle, keep the language plain.
- How would you rate your overall experience? (1 = Very poor, 5 = Excellent)
- How would you rate the quality of this product? (1 = Poor, 5 = Excellent)
- How would you rate the speed of our customer support team? (1 = Very slow, 5 = Very fast)
Scale Questions Examples
Mix in agreement scales when you want to test a specific statement rather than measure satisfaction directly. These are useful for testing assumptions about how customers perceive your brand or product.
- “This product met my expectations.” (Strongly disagree to Strongly agree)
- “Checkout was easy to complete.” (Strongly disagree to Strongly agree)
- “I would buy this product again.” (Strongly disagree to Strongly agree)
Agreement scales isolate specific beliefs you can act on. If 30% of respondents disagree that checkout was easy, you have a CRO project. A generic customer satisfaction survey score would have buried that signal.
Drinkware brand BrüMate does this well. Rather than running a generic NPS sweep across their entire catalog, they ask customers who purchased from their ERA line of tumblers to rate that specific product.
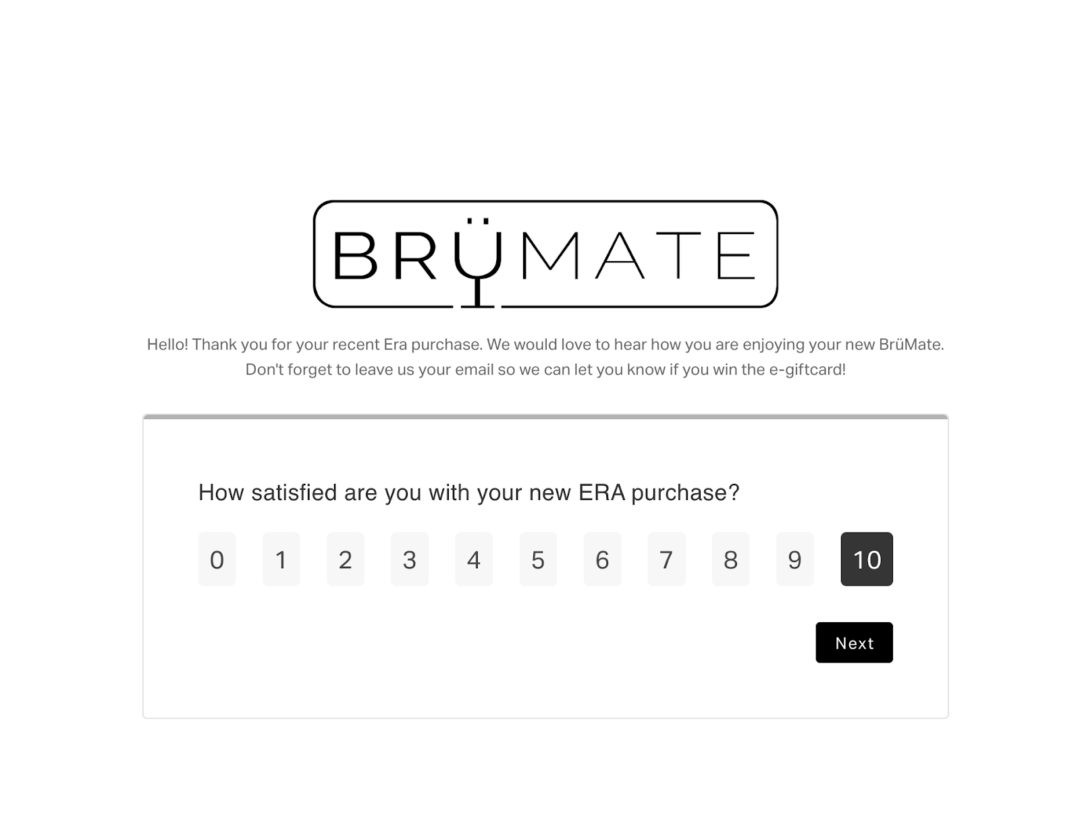
The data they get back is tied to one product line, not the average sentiment across thirty SKUs. They also pair the survey with a gift card draw to lift response rates, which is the kind of small detail that separates a CSAT program that produces real data from one that produces noise. The score is product-specific. The action you can take with it is, too.
On a Scale of 1 to 10 Survey Questions
Save the 10-point scale for questions where the spread matters. NPS is the obvious one:
- On a scale of 0 to 10, how likely are you to recommend us to a friend or colleague?
You can also use it for likelihood-to-repurchase or willingness-to-pay questions where you want to see the distribution clearly. Just do not use a 10-point scale for everything. Customers will start anchoring to 7 and 8 by default and your data will flatten.
How to create effective scale questions
The question is doing more work than the scale. A well-designed scale on a poorly written question still produces unusable data.
Sample Scale Questions
A few examples that hold up:
- How satisfied were you with how quickly your order arrived? (1 to 5)
- How easy was it to find the product you were looking for? (1 to 5)
- How would you rate the fit of this product? (1 = Too small, 3 = True to size, 5 = Too large)
- How likely are you to purchase from us again? (1 to 5)
- How well did this product match the description on our website? (1 to 5)
Each one isolates a single dimension. Speed of delivery. Ease of finding. Fit. Repurchase intent. Description accuracy. Every one of these can be acted on individually. Pair them with an open-text follow-up and you have both the score and the reason behind it.
Tips for Writing Rating Survey Questions
A short list of rules that prevent most CSAT mistakes:
- Ask about one thing per question. “How satisfied were you with the speed and quality of delivery?” is two questions in a trench coat. Split them.
- Keep the scale consistent within a survey. If question one is 1 to 5, every other rating question should also be 1 to 5. Switching scales mid-survey trains customers to skim and pick the middle.
- Label your endpoints, every time. “1” alone tells the customer nothing. “1 = Very dissatisfied” tells them exactly what they are picking.
- Avoid double negatives. “How dissatisfied were you with how unclear our return policy was?” is unusable. Phrase it positively.
- Skip leading language. “How great was your experience?” is a leading question. “How would you rate your experience?” is neutral.
- Place the question after a real moment. Asking about delivery satisfaction five minutes after the order is placed produces fiction. Ask after the package actually arrives.
- Always pair the score with a follow-up. A number without a reason is hard to act on. One open-ended follow-up turns a CSAT data point into something your team can do something with.
Analyzing responses: Interpreting the scores
Collecting scores is the easy part. Knowing what they mean is where most teams stall. The point of the survey is decision-making, not data collection for its own sake.
Understanding CSAT Score Range
CSAT is reported as a percentage. Take the number of respondents who picked the top two options (4 or 5 on a 5-point scale, 9 or 10 on a 10-point scale) and divide by total responses. Multiply by 100.
If 80 out of 100 respondents gave you a 4 or 5, your CSAT score is 80%.
The score itself is less useful than the trend. A CSAT that drops from 87% to 79% over a quarter tells you something is breaking. A static CSAT of 79% might be perfectly healthy for your category. The number in isolation is just a number.
What Constitutes a Good CSAT Score?
Benchmarks vary widely by industry, but for ecommerce, anything above 80% in the CSAT score range is generally considered strong. Mid-70s is average. Below 65% means you have a real problem somewhere in the experience that needs attention.
Two caveats to keep in mind:
- Compare yourself to yourself first. Industry benchmarks are useful as a sanity check, not a target. Your CSAT trend over time tells you more than how you stack up against an average that includes brands you would never want to be compared to.
- Segment before you celebrate. An 85% CSAT might hide a 40% score among first-time buyers. Roll-up numbers can mask the segments where the experience is failing. Filter by customer type, product, channel, and lifecycle stage.
This is where survey platforms that connect responses to order data earn their keep. A CSAT score sitting in a standalone dashboard is half the story. Metrics filtered by SKU, first vs. repeat purchase, or acquisition channel are something you can act on.
NPS vs. CSAT: Comparing the metrics
CSAT and NPS measure different things. Both are useful. Neither replaces the other.
| Metric | What it measures | When to ask | What to do with it |
|---|---|---|---|
| CSAT | Satisfaction with a specific event or interaction | Immediately after the event (delivery, support, first use) | Diagnose friction in specific moments of the journey |
| NPS | Long-term loyalty and willingness to recommend | After enough time has passed to form an opinion (a few weeks post-delivery is common) | Identify promoters for referral flows, detractors for save-the-customer outreach |
CSAT tells you whether the moment worked. NPS tells you whether the relationship is working. If you only run one, run CSAT for operational improvements and add NPS once you have a system for routing the responses. If you run both, make sure they are asked at different points and the data feeds different workflows.
Turn rating scale data into decisions
A rating scale is not a decoration. It is the structure that determines whether your CSAT data is useful or just a number you report on a slide.
Match the scale to the decision. Keep it consistent. Label the endpoints. Ask about one thing at a time. Pair every score with a reason. And feed the data into the tools your team already uses to retain customers and improve the experience.
KnoCommerce gives Shopify brands the rating scale infrastructure to do this well. Pre-built templates for CSAT, NPS, and post-purchase feedback. Conditional logic that adapts the survey to each response. Native integrations with Klaviyo, Triple Whale, and Shopify Flow so a low CSAT score can trigger a save-the-customer flow before a refund request lands in your inbox.
Ready to ask better questions and act on the answers? Book a demo to see how KNO turns rating scale data into decisions.