
Shopping can bring out a lot of big feelings. Why else would they call it retail “therapy”?
But joking aside, buying a product is rarely as simple as seeing it for the first time, adding it to your cart and paying. Humans aren’t robots. In reality, we go through many logical and emotional phases in our customer journey before buying.
This is partly because the consumer decision-making process is shaped by both motivators and blockers.
Beyond the “Why did you buy?”
What does this mean? Well, most brands ask, “Why do customers buy?” But just as important to ask is, “Why do they hesitate or stop altogether?”
Here’s the harsh reality: cart abandonment rates have reached 70%, according to Baymard. This means for every ten customers who add an item to their cart, seven won’t go through with their purchase.
So, what makes more sense? Focusing on the three customers who bought or the seven who didn’t?
And sure, customers could simply be dropping off because of pricing concerns, shipping friction, or going with a competitor. But there are also several doubts or friction points that stop customers from buying that you wouldn’t know about unless you ask.
The good news is that KnoCommerce customers are already asking these important questions—and that data tells an enlightening story about buyer behaviour.
Today we’re sharing KnoCommerce data that uncovers the top reasons shoppers abandoned their carts, dropped off while browsing or bounced from your site completely.
Then, we’ll break down how you can tackle these issues head-on and help boost conversions.
The five-stage consumer decision-making process–where hesitation can creep in
Similar to the five stages of grief (ok, maybe not that similar) most customers go through a five-stage consumer decision-making process.
And unfortunately, blockers can creep in at every stage.
- Problem recognition: The initial blocker, where a customer might ask, “Do I really need this, or is this an impulse purchase?”
- Information search: Where missing reviews or unclear product info can hurt brand or product credibility and trust.
- Evaluation: Where pricing, shipping and discount issues dominate. This is also where most hesitation happens.
- Purchase decision: Where customers abandon their cart last-minute for a variety of reasons.
- Post-purchase evaluation: Where a poor first experience can discourage repeat purchases and damage loyalty. It may also lead to costly returns.
Customers love the product, so why are they still hesitating?
Even motivated shoppers who live for your products hit roadblocks that disrupt the customer journey. That’s why talking about how great your product is or competitive differentiation is rarely enough on its own.
Buyer behaviour is rarely straightforward, either. It’s influenced by price sensitivity, convenience, trust and many other factors. It’s also dependent on the individual shopper, your products and your industry.
Most friction happens in the evaluation stage of the decision-making process. This is when buyers weigh value against risk before committing.
The 5 biggest barriers to purchase
So, what are the biggest barriers to purchase? We’ve compiled survey data from KnoCommerce customers’ post-purchase surveys to reveal the top obstacles that stop customers from buying.
Unsurprisingly, pricing is still the primary hurdle…
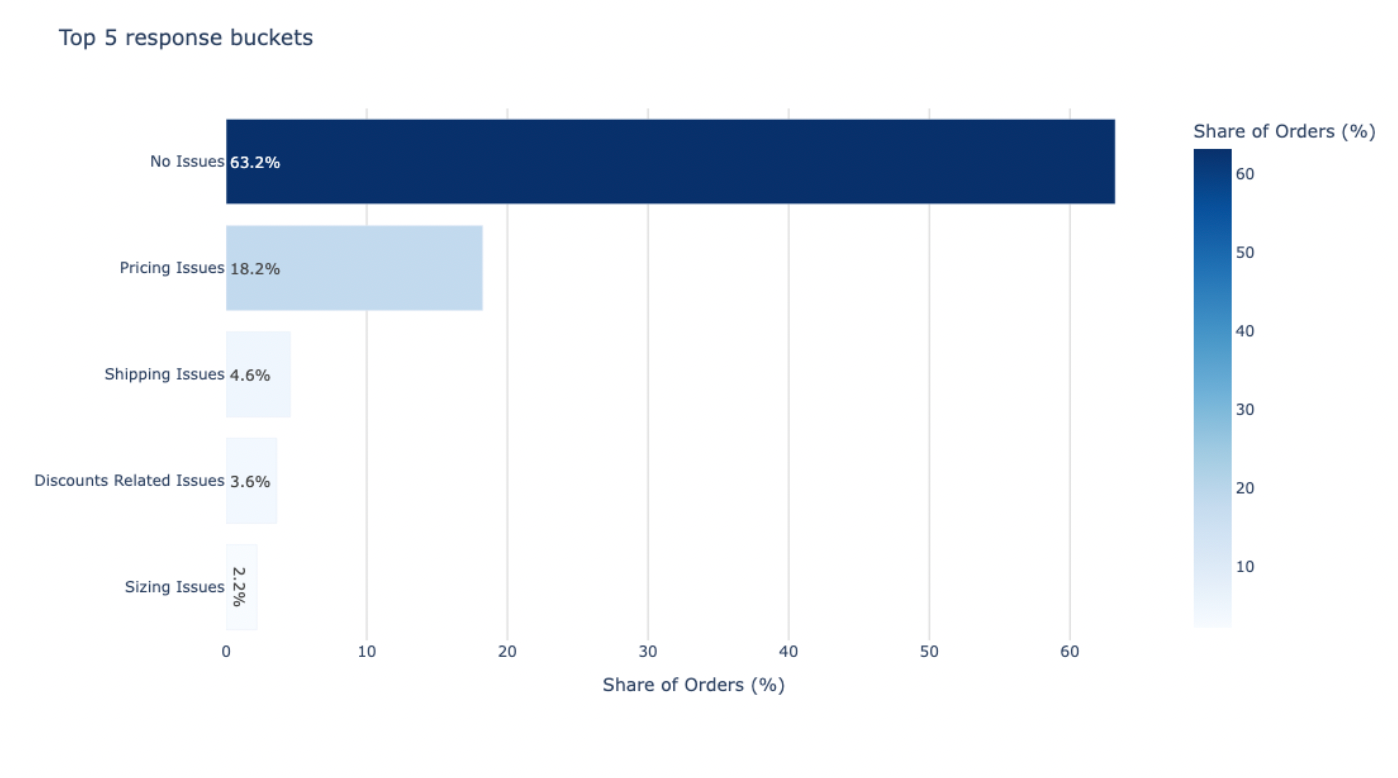
…but it’s not the only roadblock worth noting.
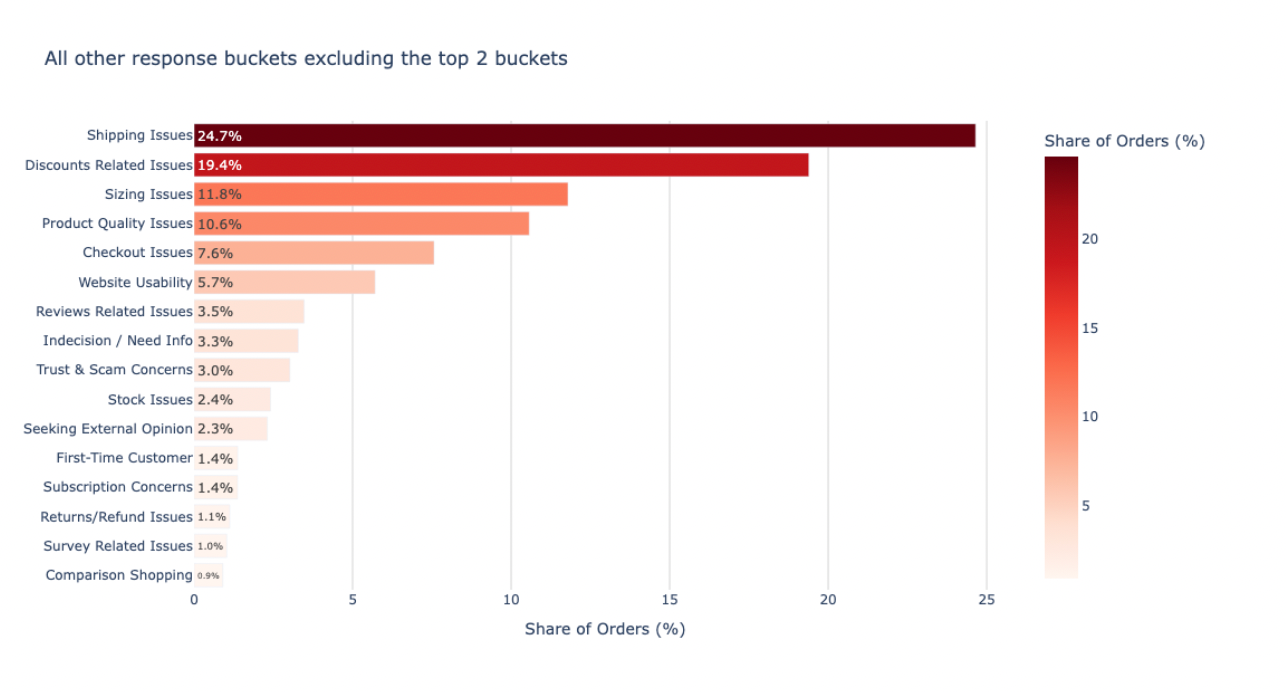
All other response buckets excluding the top 2 buckets
Let’s dig a bit more into these top 5 barriers that stop customers from buying.
1. Pricing: make sure the (complete) price is right.
Across every industry, pricing concerns are the most common reason customers hesitate. In fact, they’re cited in 18.2% of responses where an issue was noted.
However, when combined, shipping issues (4.6%) and discounts-related issues (3.6%) represent a significant 8.2% share of friction—nearly half that of pricing.
Remember: your pricing strategy doesn’t exist in a vacuum. Customers look at the total landed cost.
Solution: Optimizing shipping costs and ensuring discount clarity can be just as critical as adjusting the ticket price. That way, you can focus efforts on the entire value equation and not just one part of it. For example, $60 with free shipping sounds a whole lot better than $50 + $15 shipping.
2. Shipping: make sure there are no surprises at checkout.
Shipping issues make up 4.6% of hesitations. High costs, long delivery times and unclear policies erode trust.
It’s important to be upfront about your shipping policies throughout the entire customer journey. Make sure there are no surprises at checkout.
Solution: Try free shipping thresholds, clear delivery timelines and upfront costs. Include links to shipping policies or information blocks on your homepage and product display pages.
3. Discount confusion: make them an offer they can’t refuse.
Imagine visiting a site because you see there’s a 50% off sale—only to learn best-sellers are excluded from the promo. Not only will you likely abandon your purchase, but you’ll probably leave with a poor impression of that brand.
Don’t do this to your customers.
Promo codes that don’t work or exclusions that aren’t clear can frustrate shoppers. Discount confusion like this is mentioned in 3.6% of responses in our survey data.
Solution: Instead of promoting vague discounts or sales, be very clear in your messaging what customers can expect at checkout.
4. Industry-specific blockers: remember that your friction isn’t everyone else’s.
Every industry has its own unique opportunities and challenges. Clothing brands are constantly answering customer FAQs about sizing. Food and beverage brands are more focused on nutritional facts and ingredient lists.
This means there are also different hesitation-drivers for customers by industry.
Take a look at the top 5 buckets divided by industry below.
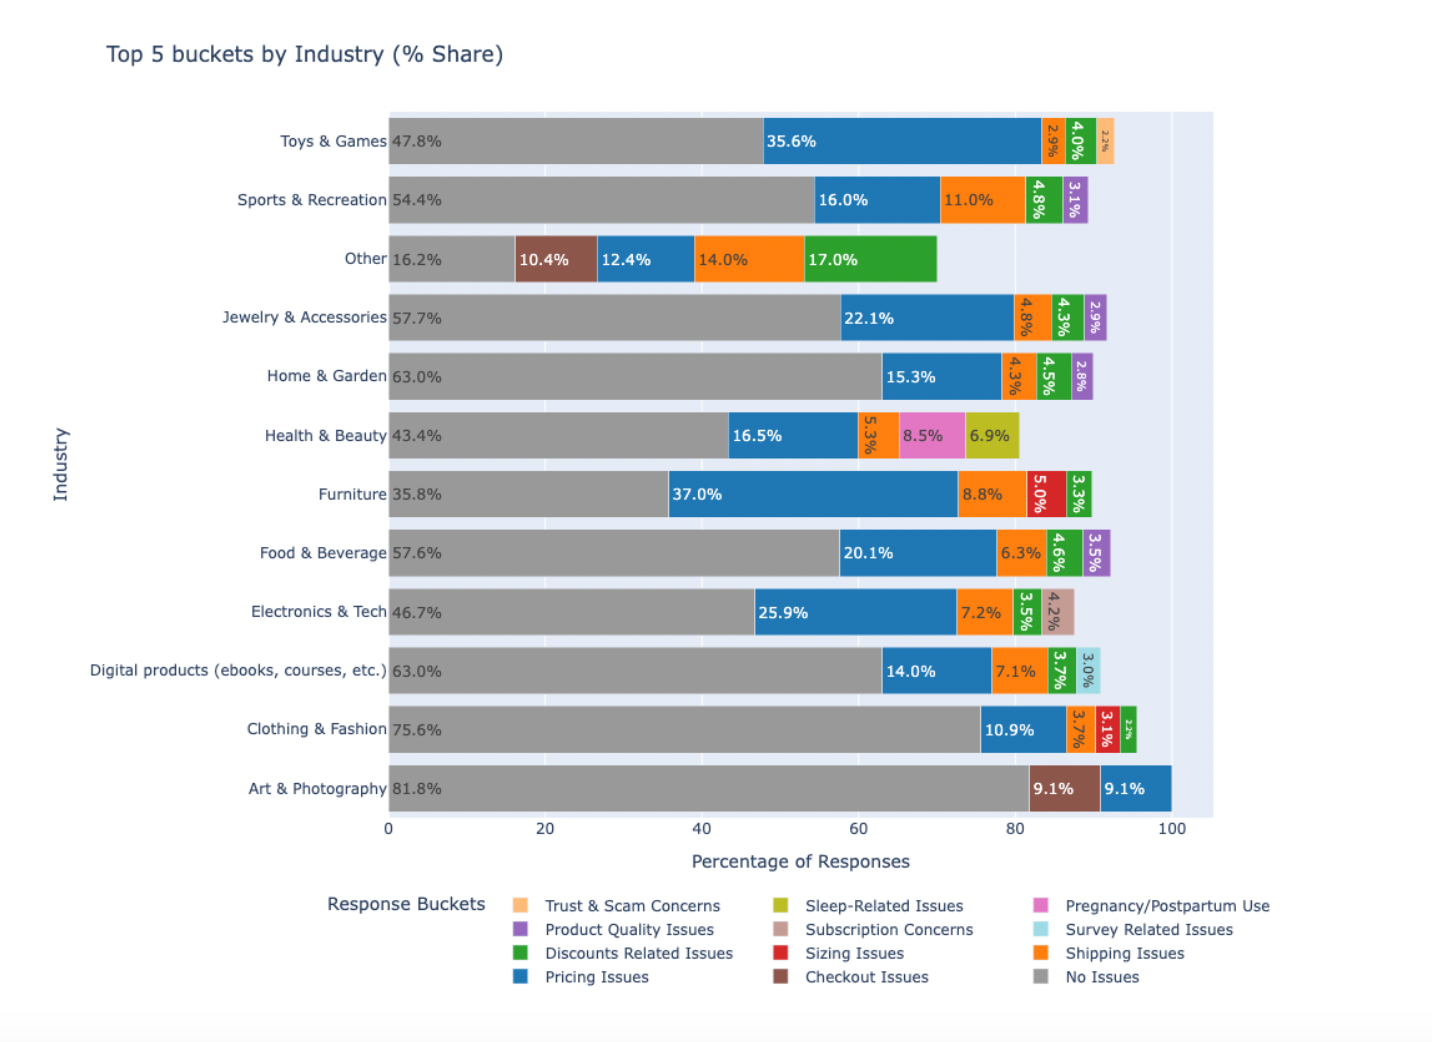
Top 5 buckets of industry (% share)
Looks can be deceiving–and averages can be misleading. The truth is the top friction points vary dramatically by industry.
For Clothing & Fashion, Sizing Issues are a major concern. For Furniture, Pricing dominates. Meanwhile, the Health & Beauty sector sees a more even split between friction points like Product Quality, Shipping, and Discounts.
Solution: One-size-fits-all solutions fail. Use this data to diagnose the specific challenges of your vertical and adopt conversion rate optimization strategies that address the root challenge. A fashion brand might invest in better sizing guides and virtual try-on tools, while a furniture brand could focus on offering flexible payment options like “Buy Now, Pay Later” (BNPL) to address their unique primary friction point.
5. The “unassigned” bucket: uncover the unknown.
The “unassigned” responses are issues that don’t fit into predefined categories. And trust us–they’re an absolute goldmine.
The “Other” industry sees a staggering 85% of its non-positive feedback fall into this bucket.
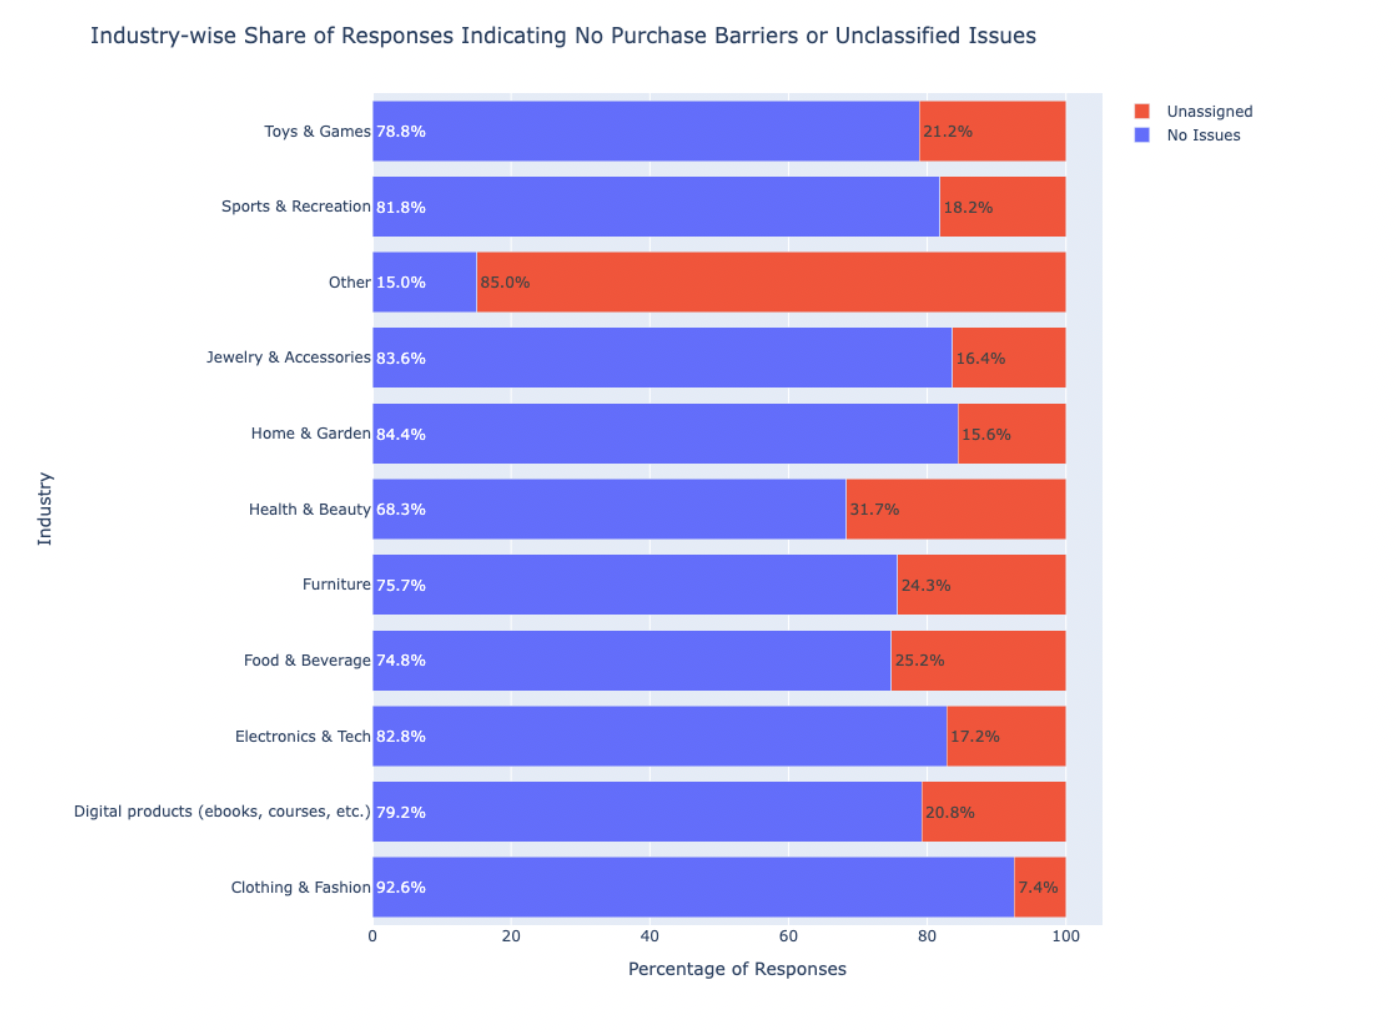
Industry-wide share of responses indicating no purchase barriers or unclassified issues
Why does this happen? Well, many hesitations don’t fit neat categories. Things like bad UX, competitor ads and unclear messaging are harder to diagnose or generalize.
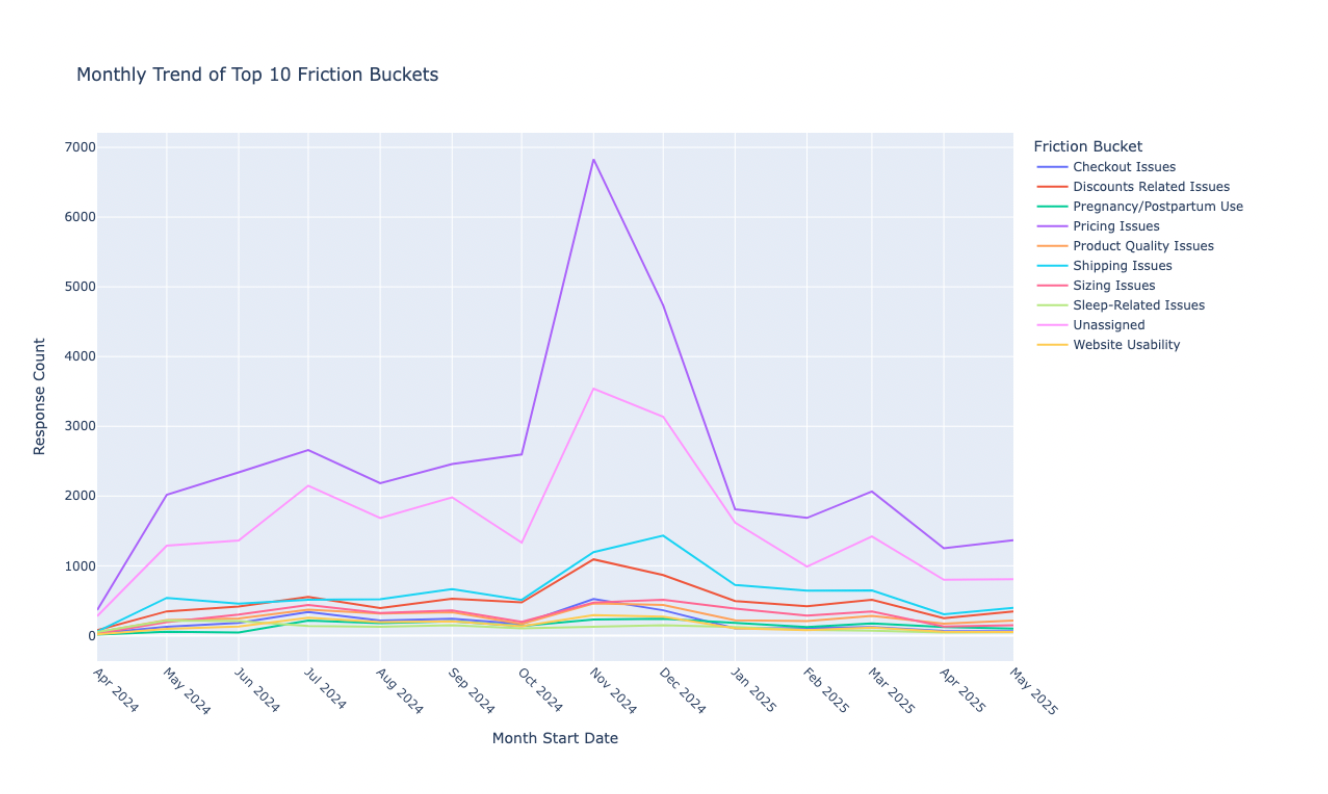
Solution: Treat unassigned responses as your early warning system. What are your customers trying to tell you that you don’t even know to ask about? A spike like the one in the graph above in November could correspond to a botched site update, a confusing new product launch or a competitor’s disruptive campaign. Use this data to investigate and resolve issues before they become widespread problems.
The cost of friction: lost sales, higher CAC, and AOV left on the table
Every hesitation point lowers conversion rates and raises customer acquisition costs (CAC).
KnoCommerce data also shows that:
- Price-sensitive buyers often abandon carts.
- Values-driven buyers spend significantly more—$240 average order value (AOV) vs. $140 for discount-driven buyers.
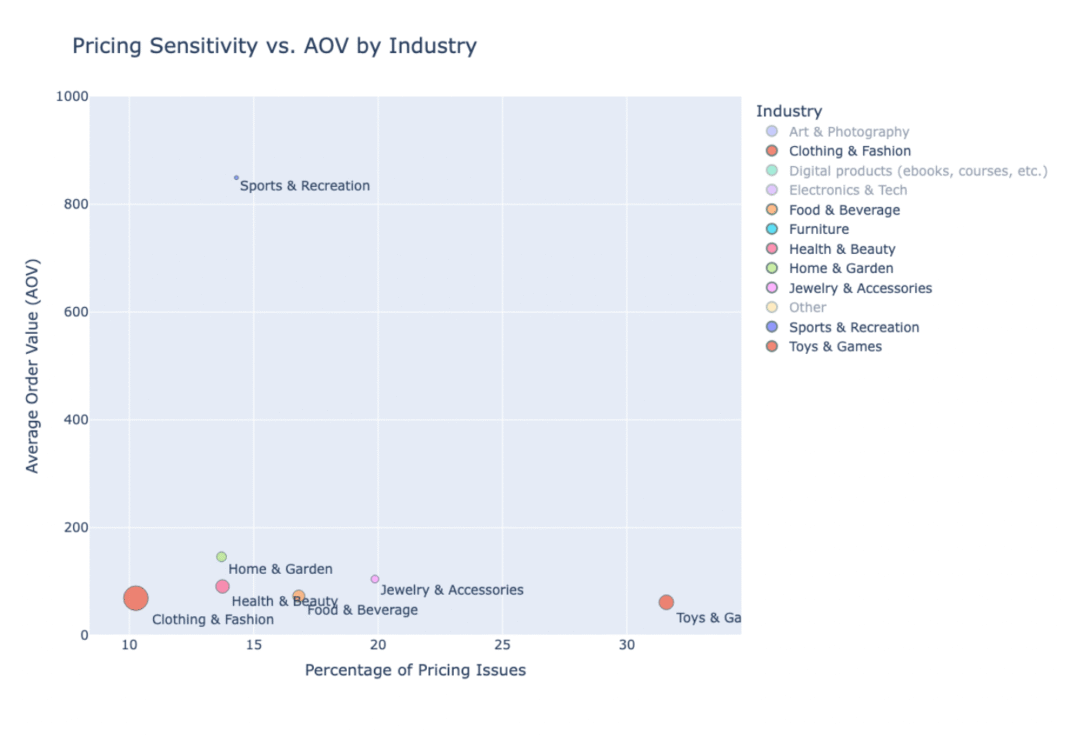
Here, the relationship between price sensitivity and AOV by industry reveals clear strategic opportunities:
- Toys & Games: High price sensitivity (>30%) with very low AOV. These customers are extremely cost-conscious, so even small increases in price or shipping can kill a sale.
- Sports & Recreation: Very high AOV (>$800) with relatively low price sensitivity (<15%). Customers here are willing to invest, giving brands more room to adjust pricing or upsell.
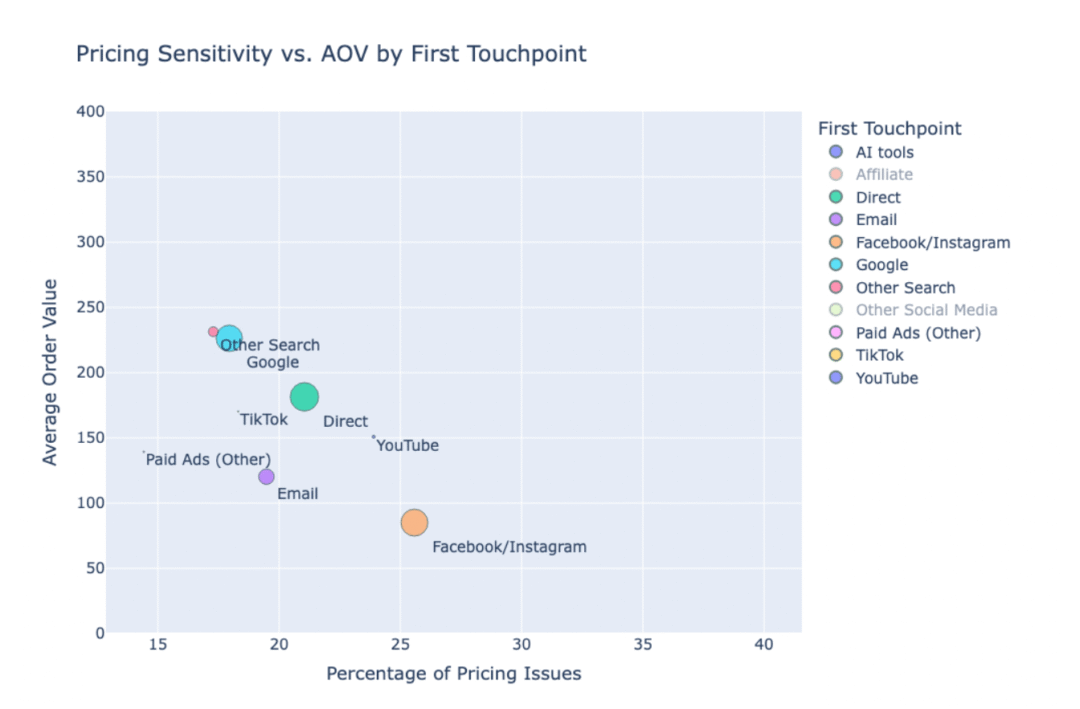
We can also look at price sensitivity and AOV by first touchpoint for even more insights:
- Facebook/Instagram (Acquisition Channel): Customers tend to be highly price-sensitive with low AOV, making this channel riskier for profitability.
- Other Search/Google (Acquisition Channel): Attracts lower price sensitivity and much higher AOV, suggesting higher ROI from organic/paid search compared to social.
These aren’t just marketing insights, either. They’re C-suite level views of business strategy:
- For marketing: Adjusting ad spend may be key. Customers from Google search are less price-sensitive and spend more, so investing in SEO and non-branded search could deliver stronger returns than relying on social ads.
- For pricing: Certain verticals (like Sports & Recreation) may have room for price increases without significant drop-off. Others (like Toys & Games) must remain hyper-competitive on price to win.
Remember: reducing friction doesn’t just recover lost sales—it helps brands optimize pricing, acquisition channels and long-term strategy.
Even more tips to remove barriers and smooth out the customer journey
The first step is to diagnose the root cause of the friction. Then, you can easily remove the issues to make the path to purchase smooth, seamless and exciting.
Use these tips below to help.
Solutions by industry
- Fashion: use sizing guides, free returns, incentivized photo and video reviews
- Furniture: use BNPL options, delivery transparency, generous warranties or guarantees
- Health & Beauty: use education, subscriptions, shade finder quizzes and virtual consultations
Solutions that can benefit every brand
- Show shipping and discounts clearly across multiple website pages and marketing channels
- Address FAQs and objections on PDPs
- Use exit-intent, post-purchase and abandoned cart surveys to uncover blockers in real time
Turn lost sales into loyalty with KnoCommerce
So, what’s the top takeaway from today? It’s important to ask, “Why do customers buy?” But it’s just as important for your marketing and product strategy to ask, “Why do they hesitate or stop altogether?” And you won’t know these friction points or blockers unless you ask.
Kno makes it incredibly simple to collect this all-important feedback with post-purchase surveys. They’ll help you identify what nearly stopped (or did stop) a customer from buying at every stage of the journey.
With Kno, you can:
- Use exit-intent surveys to capture objections.
- Use email/SMS flows segmented by hesitation type.
For example, if a customer browses a sizing chart before abandoning their search, you can reach out with a survey about sizing concerns. If someone abandons their cart at checkout, you can follow-up with a more specific pricing-related flow.
The result is improved conversions and loyalty by addressing pricing concerns, shipping doubts and those pesky hidden blockers.
Ready to learn what’s really holding your customers back?
Start asking them with KnoCommerce surveys.